
How to analyze the media landscape before launching new campaigns
The best media planning tool ever built is a piece of paper.
It has one feature nothing else on the market can match: it isn't trying to sell you anything. No inventory to move, no recommended objective, no helpful default already selected. It sits there and makes you do the thinking, which is the entire job.
Everything else you plan with is a shop. (even the based.planner - it's selling effective marketing)
Trace your steps back to the media plan
Think about the last campaign you launched.
Now try to remember the moment somebody decided which channels it would run on. Not the moment it was approved. The moment it was decided — where you sat, who argued for what, what the alternative was.
Most people can't find it. Not because they've forgotten, but because it never happened. Somebody opened Ads Manager, started building, and the plan assembled itself out of whatever was on the screen. By the time it reached a document it looked like a decision, with budgets and flight dates and a rationale written afterwards.
This isn't a small-company problem, either. The WFA and Ebiquity surveyed global brand leaders for their 2026 media budgets report, published this July. Eight in ten already run marketing mix modelling and brand lift studies. Only 15% said effectiveness outputs are the primary driver of their budget decisions. Only 14% said marketing and finance were fully aligned on what effectiveness even means.
So the largest advertisers in the world, with the best measurement money can buy, are mostly not allocating budget on the evidence. Something else is deciding. That something is usually whatever was already there.
What is first-platform bias?
First-platform bias is the tendency for whichever ad platform a team opens first to become the de facto media plan — setting the options, the audience definition and the measure of success before anyone has consciously chosen any of them.
It's worth separating from a term it sounds like. In competition law, "platform bias" means a platform favouring its own products. First-platform bias runs the other way. It isn't something a platform does to you. It's something an interface does to your thinking, and nobody at Meta or Google has to lift a finger for it to happen.
It also isn't a mistake anybody made. Nobody stood up in a meeting and proposed outsourcing strategy to a company that sells impressions. It's what happens when the tool arrives before the thinking does, and the tool is very good, and it's right there, and everyone is busy.
Why does the first platform you open become the plan?
Because opening it hands over three decisions before you've noticed you made them.

It sets your options. You can only choose from what the platform sells. Meta will never suggest cinema. Google will not mention the trade magazine your buyers read on the train, or the conference where half your category does its actual business, or the fact that nobody in your market has run a poster campaign since 2011. Not out of malice — those things simply aren't in the catalogue, and a catalogue's silence looks identical to absence.
It sets your audience. You describe your buyer using the platform's taxonomy, because that's the only box available. "Women 25–44, interested in skincare and wellness" is not a person. It's an inventory category, built from what the platform can observe and monetise, and it bears the same relationship to your customer that a supermarket aisle label bears to your appetite. Once you've written your buyer down in those words, you'll keep thinking in them. They'll turn up in the creative brief. They'll turn up in the deck you show the board.
It sets your scoreboard. The metrics you report become the metrics the platform can measure, which are — conveniently — the metrics it can take credit for. That isn't a conspiracy, it's what a measurement system is: an instrument that reports on its own territory. Analytic Partners' ROI Genome work, built on mix modelling across hundreds of billions of dollars of spend, found that last-click attribution overstates paid search by roughly 336% and display by roughly 364%, with about 35 cents of every dollar allocated that way going to waste.
The cleanest demonstration of this is eleven years old and still the best thing anybody has published on it. Blake, Nosko and Tadelis ran a large-scale randomised field experiment at eBay and put it in Econometrica. They switched off paid search advertising in some markets and not others, and found that ads on eBay's own brand keywords produced no measurable short-term benefit — the people clicking were people who were coming anyway. Returns on non-brand search were, on average, negative. Their conclusion about the gap between the two methods is the sentence to remember: measured returns from the platform's own reporting were "a fraction" of the returns the experiment found.
Not a vendor study. Not an agency white paper. A peer-reviewed experiment in a top-five economics journal, free to download, run by economists with nothing to sell.
The platform is not lying to you. It is doing something more comfortable and harder to argue with: it's marking its own homework, and the marking scheme is one it wrote.
Now watch those three compound. Next quarter's plan starts from this quarter's reporting. The channel that got over-credited gets more budget. The channel that was never in the catalogue stays invisible, forever, because it never generated a number to defend itself with.
Three years of that and your media strategy is really an archaeological record of which tab was open first.
This is the oldest idea in media studies
Advertising already believes all of this. Everyone at based.marketing believes it. We all just collectively believed it's about somebody else's medium.
Every planner can tell you that the same thirty seconds means something different in a cinema and on a phone in a supermarket queue. That's McLuhan, absorbed so completely that nobody bothers citing him. Understanding Media came out in 1964, the industry took the headline — the medium is the message — and applied it, correctly, to the media it buys.
Then it plans the buying inside a medium and never asks what that one is doing.
McLuhan's actual claim is stranger than the slogan. He wasn't saying content doesn't matter. He was saying a medium's real effect is the change of scale and pattern it introduces into whatever it touches, and that this happens whether or not anybody notices. His example was the electric light: a medium with no content at all, which reorganised night, work and cities anyway.
An ads manager has content — your campaign. Its message, in McLuhan's sense, is the shape it gives the thinking that happens inside it.
The person who made this precise was McLuhan's older colleague at Toronto, Harold Innis, and he's the one actually worth reading here. The Bias of Communication (1951) argues that every medium has a bias — not a prejudice, a structural predisposition. By its physical properties a medium makes some things cheap and easy and others expensive and hard, and whatever gets built on it tilts accordingly. Stone is durable and immovable, so it binds time: it carries meaning across generations, to very few people. Papyrus is light and perishable, so it binds space: it carries administration across an empire, and rots. Innis's warning was that a culture over-committed to one bias develops what he called a monopoly of knowledge — it stops being able to think in the other register at all.
So ask what an ads manager is biased toward.
It's a space-binding instrument. It makes reach-per-euro cheap to see and duration expensive to see. It can tell you what happened in the last twenty-eight days to four decimal places and has almost nothing to say about what will still be true in three years. Plan inside it long enough and you don't get a bad plan. You get a plan that can only think in one register, run by a team that has genuinely forgotten the other one exists.
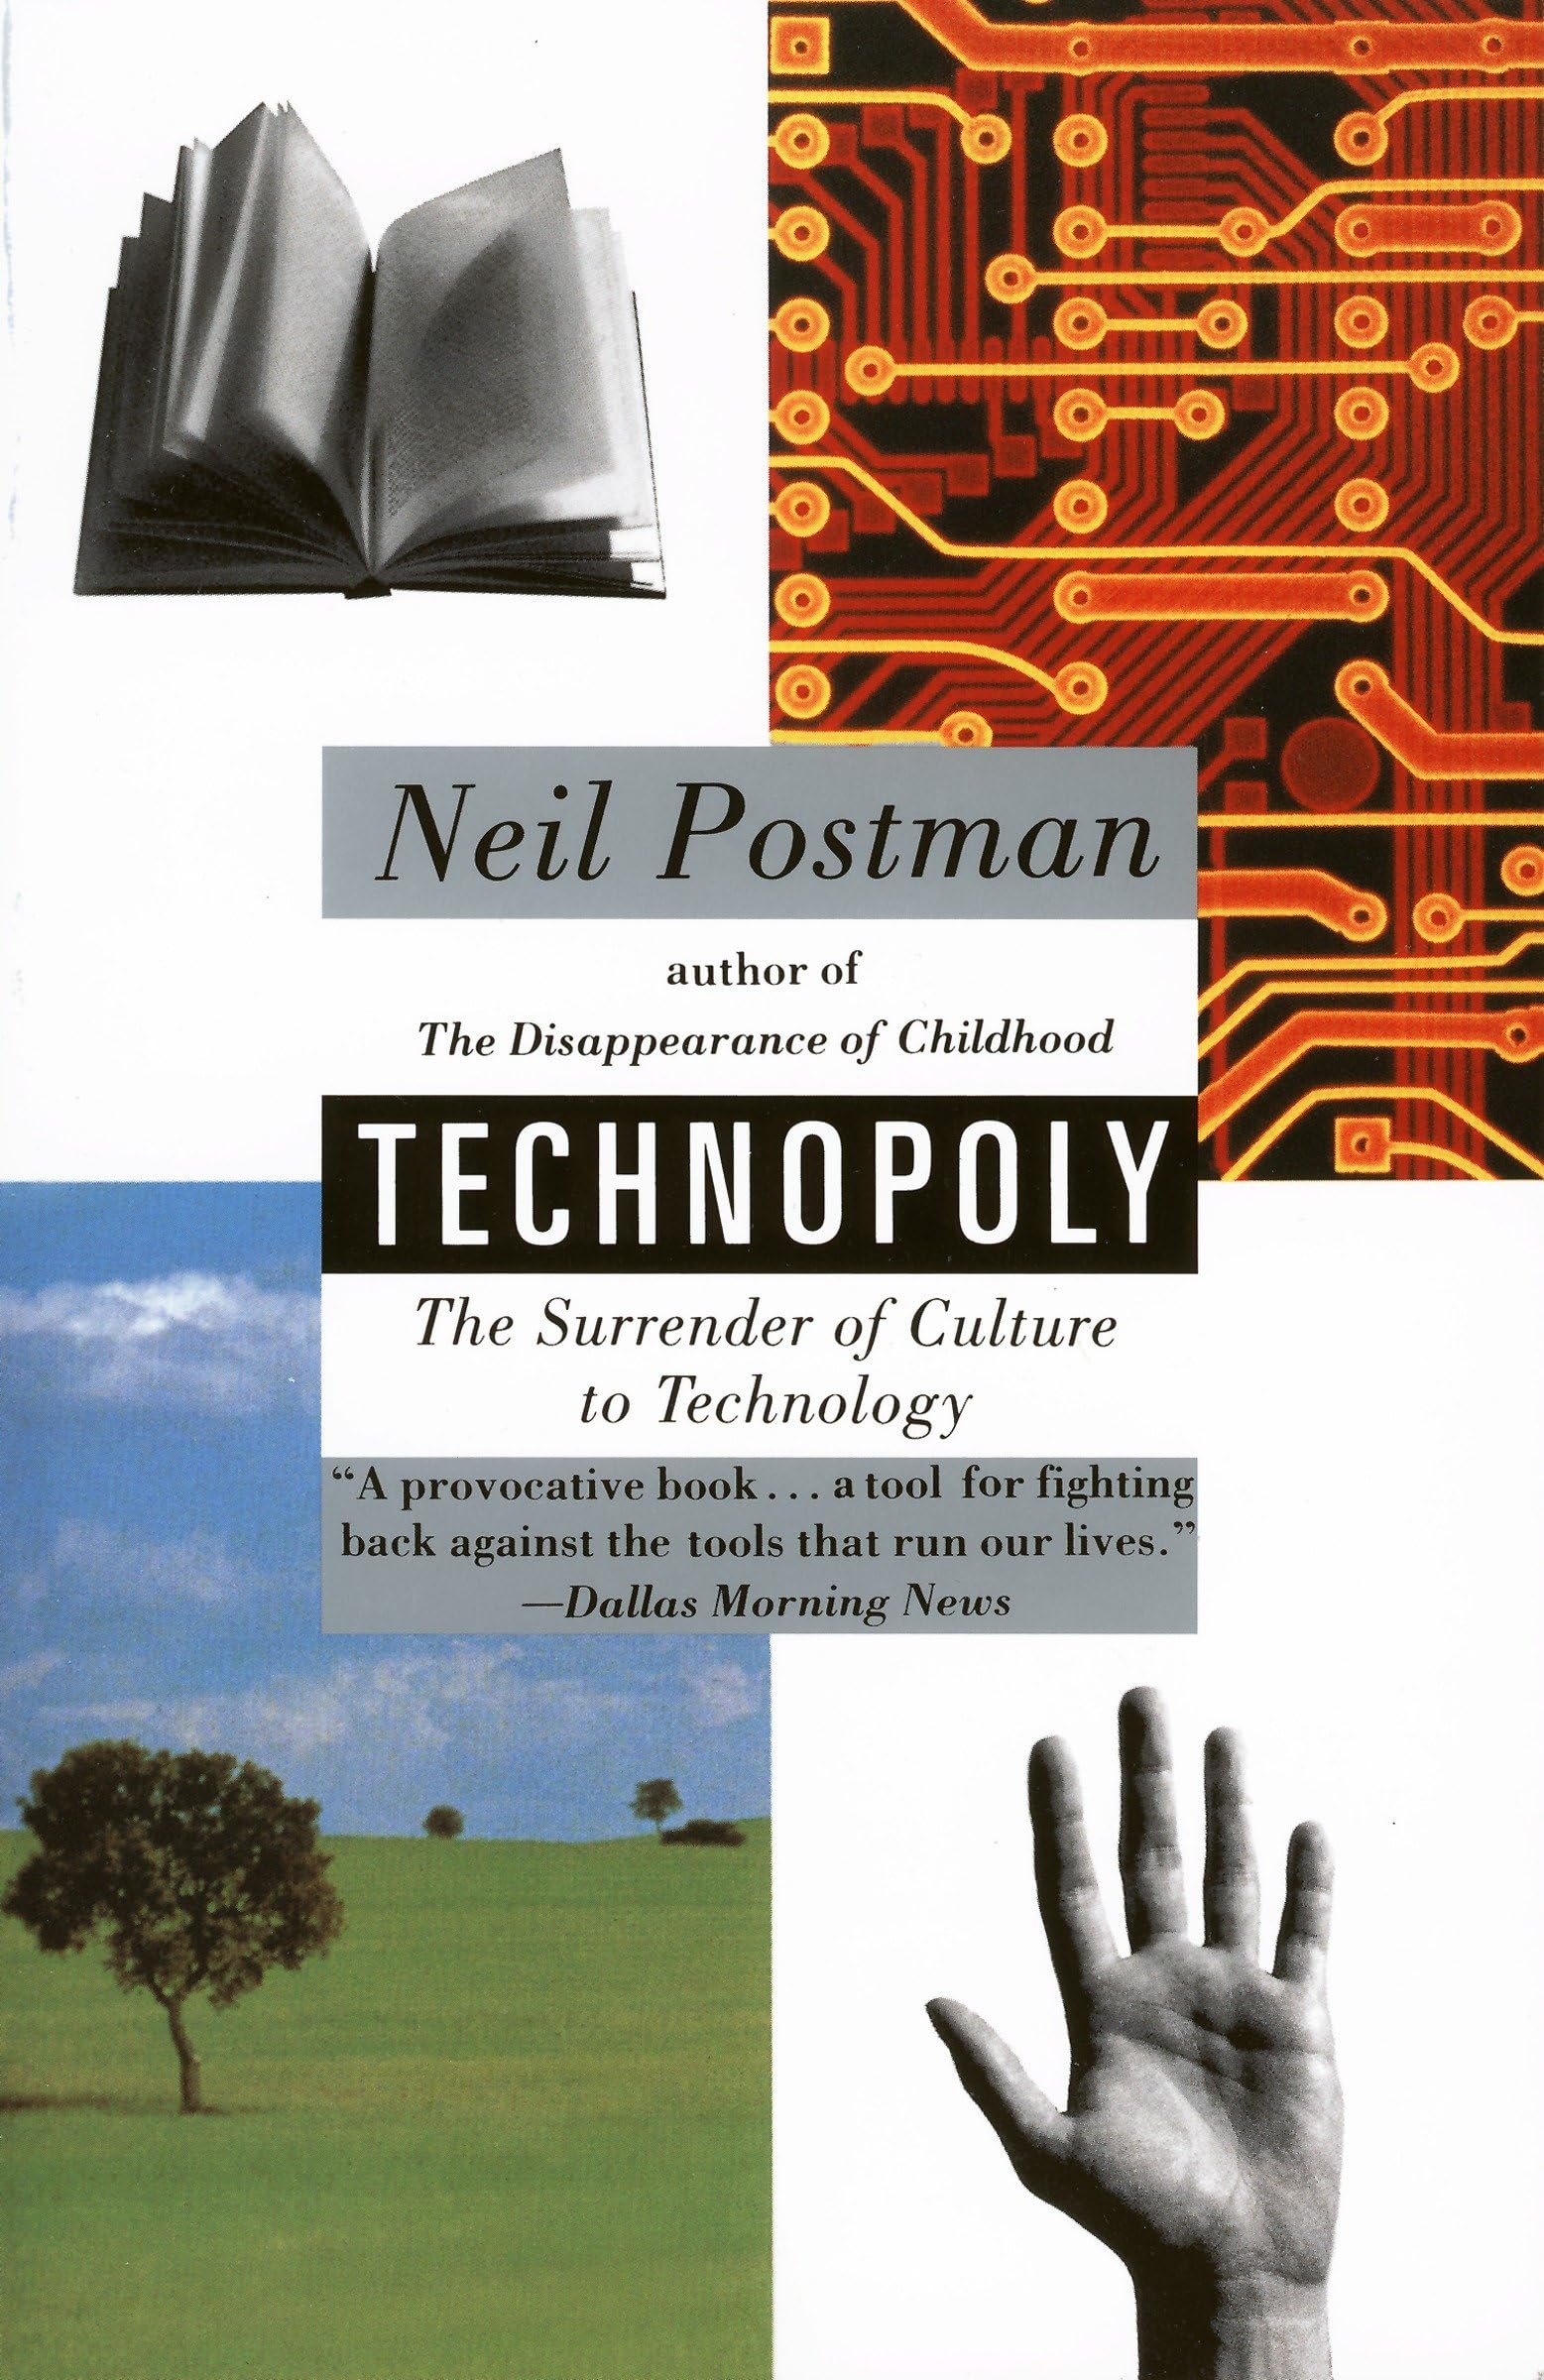
Neil Postman wrote the sentence this whole article is trying to write, in 1992, in Technopoly, having never seen a campaign objective dropdown:
"Embedded in every tool is an ideological bias, a predisposition to construct the world as one thing rather than another, to value one thing over another, to amplify one sense or skill or attitude more loudly than another."
That's it. That's the entire argument, thirty-four years early.
McLuhan's useful line for what to do about it isn't the famous one. It's this: environments are invisible. You cannot see the thing you're standing inside. Which is why the fix has to be procedural rather than clever — you don't out-think the bias, you just refuse to start inside it.
What can't you see from inside an ads manager?
The thing that would actually help you: where the bargains are.
Here's the fact the whole discipline rests on and almost nobody plans against. Attention and advertiser money are not distributed the same way. People do not allocate their days in proportion to how advertisers allocate budgets. Nothing forces those two distributions to match, and they never have. Where a lot of money chases a small amount of attention, you overpay — you're bidding against everyone else who opened the same tab. Where attention sits with nobody bidding on it, you get it cheap.
That gap is not a rounding error, and eMarketer measures it directly. In its 2026 comparison of US ad spending against time spent with media: social networks take 27.7% of ad spending for 12.5% of media time. Connected TV gets 7.7% of the spending for 20.2% of the time.
Read those two lines again. One medium is paid roughly double its share of attention. The other is paid roughly a third of its share. That is the entire opportunity, stated as a number, by the research service your competitors also subscribe to.
The eMarketer report is paywalled, so here's a version anybody can check with a calculator. eMarketer separately forecasts US CTV ad spend at $37.95bn in 2026 against a US total above $485bn. That's 7.8%, which lines up. The mismatch is huge, impactful and you don't need a subscription to see its importance.
The concentration behind it is not subtle either. Google, Meta and Amazon together are forecast to take around 62% of global digital ad spending in 2026 — roughly 48% of all advertising once you include traditional media. Three companies, about half the money on earth.
Nobody spends half their life inside three companies' products.
And there's a fingerprint. Peter Field, working with Lumen and Newsworks, matched attention data — attentive seconds per thousand impressions — against IPA Databank cases. High-attention media went from 68% of the media mix in 2015 to 30% in 2025. Low-attention media went the other way: 32% to 70%.
Read that as a decision and it makes no sense, because nobody made it. No planner ever stood up and argued the industry should more than halve its exposure to the media people actually look at. It happened one plan at a time, in tools that only sell one kind of inventory. First-platform bias, at industry scale, visible from space.
Field's numbers suggest the trade cost something. Pound for pound, high-attention plans delivered around 12% more market share growth, and 58% more attentive seconds per pound spent. Worth saying plainly that Newsworks is the UK news industry's marketing body and had a horse in the race — but the mix-shift figure isn't a claim about who should win. It's a description of what everybody did.
And the thing the platforms sell hardest isn't the thing that most decides the outcome. Binet and Field went through the IPA's effectiveness data for Media in Focus and put it flatly: "Scale of a medium is the primary driver of effectiveness, and whilst tight targeting and loyalty are great for short-term efficiency, they are not strategies that build market share."
That report is from 2017, which predates CTV at scale, TikTok and retail media, so treat it as a principle rather than a bulletin. The principle has held up. The Ehrenberg-Bass Institute analysed 3.1 million ad exposures from a personality-targeting experiment and found the matched ads produced low click-through rates — and in places the mismatched ads did better than the matched ones. Ehrenberg-Bass has no inventory to sell, which is worth saying in a field where almost everybody publishing attention research owns a medium.
Their explanation is the useful part: brands grow through light and non-buyers, and interest-based targeting is precisely the mechanism that removes light and non-buyers from your reach. You are paying a premium for the option to exclude the people who would have grown you.
What is media landscape analysis?
Media landscape analysis is the work of mapping where a specific audience actually spends attention, and what it costs to reach them there, before committing to any channel or platform. The output is a shortlist with reasons attached. It is not a media plan, it's the thing you write a media plan from.
One clarification, because the phrase is used two ways. In PR and communications, media landscape analysis usually means monitoring coverage and sentiment — who wrote about us, how did it read. That's a different job. In media planning it means the audience-and-cost mapping described here. Same words, different discipline, and the confusion is part of why nobody does the paid-media version properly.
The rest of this is how to do it.
The paper plan
Six steps. No logins. You can run it in a room with a whiteboard in an afternoon, and you should run it before anybody has permission to spend anything. For people selling based.planner - a media planning tool for agencies and inhouse teams that speeds up and makes campaign planning and setup more convenient, that's a very naive thing to share, but why not.
Step 1: Who is the buyer - in their own words?
Write the buyer down as a person doing something, somewhere, at a time — not as demographics or interests. The test is whether somebody could recognise this person in a room, and whether a salesperson who has actually met one would read your description and nod. If it reads like a targeting category, you've written down the platform's answer rather than your own.
Then answer the harder question: what would make this person think about your category at all? Not choose you — think about the category. The gearbox fails. The kid outgrows the shoes. Somebody at the next desk mentions their supplier. Somebody sees a price and gets annoyed.
Those moments are where demand actually starts, and most of them happen nowhere near an ad.
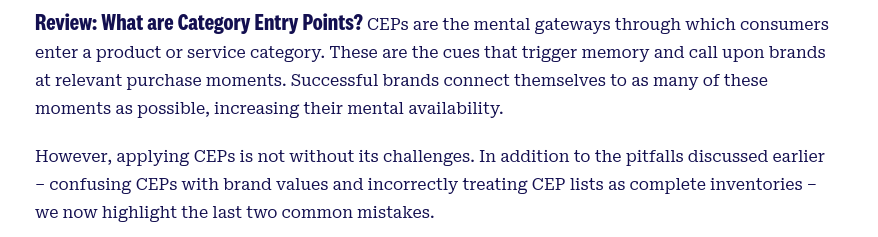
This isn't improvisation, by the way — it's an established discipline with a name. Jenni Romaniuk and Byron Sharp call them category entry points: the needs, occasions and situations that cue somebody to think of a category, and therefore the moments at which a brand can be pulled out of memory. Romaniuk's framing is that they're the building blocks of mental availability. The more of them your brand is attached to, the more often it gets retrieved.
There's no canonical number of them, and anybody who quotes you one has invented it. You're looking for the ones that are most common and most relevant in your category.
Write down as many as you can find. That list is what you're trying to be present for, and no platform will generate it for you, because these things happen in the world and a platform can only see the internet.
Step 2: Where does their attention actually go in a week?
Take seven days and map every place this person's attention goes. Commute, work, evening, weekend. The trade press and the group chat, the podcast, the school gate, the industry Slack, the retail park, the four hours of television nobody admits to. A funnel is a model of your sales process; a week is a model of their life. You want the second one.
Include the hours when they aren't buying anything, because that's most hours, and those are the ones where being remembered gets decided.
Include offline. This is the step everybody skips, and it's the step that produces the actual insight — offline is where the least competition and the most attention still overlap. Look again at that 68%-to-30% shift. It's mostly this
If you want a sense of how spread out attention actually is, GWI's brand discovery data in DataReportal's Digital 2025 is free and takes a minute to check. Not one discovery route reaches a third of people. Search engines 32.8%, TV ads 32.3%, word-of-mouth just under 30%, social media ads 29.7%, brand websites 25.8%.
There is no dominant channel. There hasn't been one for years. If the biggest single route to discovery reaches roughly one person in three, then a plan built inside one ad platform is, arithmetically, a plan that has decided to skip most of the market.
McKinsey has run its B2B Pulse survey since 2016. Buyers now use around ten channels across a purchase journey, roughly double the five they used at the start. Buyers spread out. Most plans didn't follow them.
Step 3: What's happening around them?
Attention has weather. A map that's accurate in June will be completely thrashed and destroyed by October, and bad news - not due to how good your marketing was.
So before you price anything, write down the conditions. Four kinds of those:
The calendar you don't control. Elections buy up inventory at a scale no advertiser can match, and they do it for months, in specific markets. Major sport does the same. So do the category's own fixed points — the trade show everybody goes to, the regulatory deadline, the season when your product stops making sense. Some of these raise your prices. Some of them change who's listening. They're not the same problem and they don't have the same answer.
The economy your buyer is living in. What a price means changes with conditions. The same £40 reads differently against rising energy bills than it did two years earlier, and a message built for one reads as tone-deaf in the other. This isn't sentiment analysis, it's just knowing what's expensive this year.
The political and cultural temperature. Every category has topics that are currently live, and being adjacent to one is either the best thing that happens to your campaign or the worst. You don't need a position on everything. You do need to know what conversation you're walking into, because the audience will place you in it whether you meant to be there or not.
What's changing structurally. Regulation on what you can say and where. Platform policy. Supply chains, tariffs, distribution. Anything that could make a channel unavailable or a claim illegal between planning and launch.
Here's why this belongs in a media plan rather than a strategy doc. Context doesn't only change where attention is. It changes what your message means when it lands. Same creative, same placement, three months apart, different message — because the room changed and you didn't.
The output of this step is short. A page of conditions and a note against each one: does this move attention, move price, or move meaning? Most move at least two.
Step 4: Where is the f*cking money, Lebowski?
Go back over the attention map and mark how crowded each place is. You are not looking for good channels at this stage. You are looking for crowding, because crowding is what you're being charged for.
This is the price map, and it's the step where the platforms earn their keep. Check what things cost. Read the ad libraries. See who's running what — and how long they've been running it, because longevity is the cheapest performance signal you'll ever get. Nobody keeps paying for an ad that isn't working. A creative that's been live for eight months is a competitor telling you their results out loud.
But do the competitor work properly, because this is the step most teams do badly. Three little questions:
What are they actually running, and where? Not what their case studies say. What's live right now, in which markets, in which formats. Ad libraries make this free.
How loud are they, relative to their size? This is share of voice, and it's the number that matters more than spend. Binet and Field's work on the IPA data put the relationship at roughly ten points of excess share of voice — your share of category noise minus your share of market — buying something in the region of half a point to seven-tenths of a point of market share growth a year. The coefficient moves by category and everyone quotes it slightly differently, so treat it as a direction rather than a formula.
The direction is what you need. If a competitor's share of voice sits well above their share of market, they're buying growth and you will feel it in twelve months. If yours sits below, you're funding somebody else's.
Is anyone actually thinking of them? Share of voice is what a brand spends. Share of search is what people do. Track both and the gap tells you something: heavy spend with flat search is a brand shouting into a room that has stopped listening, and that's a competitor you can take ground from cheaply.
Use the tools as instruments here. Just don't let them set the agenda — you're bringing them a question, not asking what you should want.

One free instrument worth knowing, because it belongs to nobody. Les Binet presented share of search at the IPA's EffWorks in 2020 — your brand's share of organic Google searches within its category, pulled from Google Trends, tracked over time. He found it ran ahead of market share, and the useful detail is how much it varied: about a year's lead time in cars, roughly six months in mobile handsets, nought to three months in energy. Anybody quoting you a universal "six to twelve months" has flattened the finding.
Two honest limits before you go and try it. Ambiguous brand names wreck it — Google Trends can't reliably tell your brand from the ordinary word it's named after. And low-volume brands frequently return nothing at all, which is an awkward property in a method aimed at small brands. If you're too small to register, that's information too, but it isn't a measurement.
Step 5: What's left when you subtract one map from the other?
Lay the attention map over the price map, with the conditions from step three sitting on top of both. Where your buyer's attention is and the money isn't — that's the shortlist. This is the only step that produces a decision, and the output is usually shorter and stranger than anyone expects.
One honest caveat, because this is where the exercise can flatter you. Some gaps are gaps for good reasons: you can't buy it, or it can't be measured well enough to defend, or the audience is actively hostile to advertising in that context, or it's regulated into the ground.
Separate underpriced from unbuyable before you get excited. A real bargain has three things — attention, no queue, and a way in. Two out of three is a hobby.
Step 6: When should you finally open the platform?
Now. And notice how differently you use it.
You're no longer browsing, you have a shortlist and you're looking for how to buy specific things for specific reasons. The interface stops being a menu and goes back to being a checkout, which is what it always should have been.
You'll also find you argue with it more, which is the sign it's working. When the platform recommends a default objective that doesn't match the plan, you'll notice — because there's a plan to compare it against. That's the whole benefit. Not that the platform is wrong, it's often right, but that you can finally tell.
Where do you get any of this without a research budget?
Every other guide to this assumes you either have a Nielsen panel or you don't need one. If you're somewhere in between — too serious for guesswork, too small for a six-figure subscription — nobody has written you anything.
Them's the stacks. Most of it costs nothing.
One of the many moments to admit our pro-european stance with the fact that European teams have better data than American ones. This is real, and almost nobody uses it. The Digital Services Act obliges every large platform to run a public, searchable repository of every ad shown in the EU — creative, advertiser, who paid, run dates, targeting parameters, aggregate reach by member state, kept for a year after last impression. TikTok's Commercial Content Library covers the EEA, Switzerland and the UK, and it's a genuine archive rather than the curated highlight reel a US team gets from Creative Center. Meta's EU records carry reach and targeting fields that don't exist elsewhere, God bless them.
You can't outspend anyone. You can, in Europe, out-see them. So use it like we use it.